With the enactment of Freedom of Information Act, 2002: An Act to provide for freedom to every citizen to secure access to information under the control of public authorities, consistent with public interest, in order to promote openness, transparency and accountability in administration and in relation to matters connected therewith or incidental thereto.
The people of our country now therefore have a right to their own views, to promote them in informed discussions, demand transparency in government, and to offer criticism without fear. The courts have repeatedly affirmed these, but the quest to realize them is far from over. The position pretty much clearly established in law, there is little doubt that information is not as free as scientists or other common citizens would like it to be. With reference to GIS, there are mounds of information to which the general public are still denied access. Maps of numerous areas are restricted beyond a particular scale. Given this situation, how do we expect the basic tenets of our democracy to put forward their views in the absence of GIS literacy and lack of geospatial democracy? Most government sector agencies do not understand the value of their data, and either do not release it or do not know how to price the data.
The objective of this paper is:
To create awareness on the need to integrate GIS into our daily planning activity at various levels.
To show how GIS can effectively analyze different demographic and development indicators of India at state level and arrive at conclusions.
To show that “GIS holds the key to unlocking a nations potential” and Geospatial Democracy is the need of the hour.
Urban planning & GIS – an overview
Planning is a future-oriented activity that links "scientific and technical knowledge to actions in the public domain. It happens through a public discourse between all groups and individuals interested in and/or affected by urban development and management activities pursued by the public or private sector. Planning-related decisions are made daily through a complex, often politically charged process involving plurality of interests. Moreover, the implementation of those decisions makes a long-term imprint on the urban structure, functionality, and quality of life in urban environments. While most of urban and regional planning happens at the local level, national and state policies and legislation often influence planning activities.
Role of GIS
The demographic and other development indicators for a planning area may be available in different forms such as paper maps, photograph, textual, graphical or tabular form to the planner. Integration of these multifarious data and their analysis is a tedious, time consuming and a real Herculean task for the planners. Moreover basic things like preparation of base maps by traditional methods take away the time and resources of planners, leaving little or no time for an elaborate analysis of the data collected in an effective manner.
It is in this context that GIS find importance as a tool to enhance their analytical, problem-solving, and decision-making capability of the planners. From the late 1950s planners started to develop and use computerized models, Planning Support Systems (PSS), Planning Information Systems (PIS) and Decision Support Systems (DSS) to improve performance. Adoption of Geographic Information Systems (GIS) is a more recent manifestation of the same effort to incorporate new tools and technologies.
India: the tiger speaks GIS
One who visits India for the first time is sure to be enthralled in its vivid kaleidoscope of landscapes, magnificent historical sites and royal cities, golden beaches, misty mountain retreats, colorful people, rich cultures and festivities. But for the hoi polloi, who else could say if the harsh realities, problems and paradoxical situations confronting them, have been hidden behind the tall skyscrapers and in the veritable concrete jungles of the cities of India.
To understand the current state of affairs in various states of India and to demonstrate how GIS can be effectively used in planning, few demographic data and development indicators like:
Population
Population density
Sex Ratio
Literacy and
Urbanization
at state level have been taken up for analysis.
Let us hear the fascinating story that the tiger country: India has to speak to us in the language of GIS.
Population
The total population of India as at 0:00 hours of 1st March 2001 stood at 102,70,15,247 persons. In terms of population it became only the second country in the world after China to cross the one billion mark. At the state level, Uttar Pradesh tops the list with a total population of 16,60,52,859 persons, followed by Maharashtra. Interestingly a grid thematic analysis (Figure 1) of the population growth rate (1991-2001) using GIS throws more light on the fact that Nagaland which is in the twenty fifth place in terms of total population however comes first in terms of the growth rate, with Delhi in the fourth place. The red spots in indicate a population growth rate of over 50% between 1991-2001.
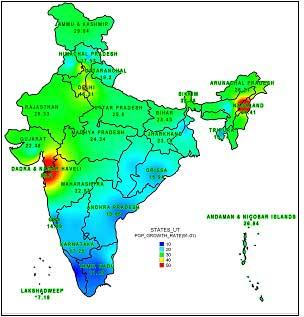
Figure 1: Population growth rate (1991-01)
Population Density
An important index of population concentration is its density measured as number of persons per square kilometer.
According to world development report (2000-01) of World Bank, the world average is 46 persons per sq km and for low-income countries the average is 73. A thematic map (Figure 2) using GIS shows that Delhi tops with 9294 occupying one square kilometer area. Population density is a good indication for overcrowding especially in cities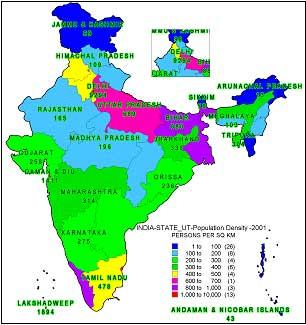
Figure 2: Population Density (2001) Persons per Sq. Km
A dot density thematic of population density growth factor between 1991 and 2001 (Figure 3) shows the drastic change in the density in Delhi and adjoining states where the growth factor is over 1.25 as evident from Figure 3. In Delhi about 3000 more people are occupying the same space in 2001 as compared to the year 1991. As the density of population increases the need for infrastructure increases. A case of expanding population and finite resources, calls for population stabilization so that undue pressure is not put on its natural resources to support the rising population.
Figure 3: Population Density (1991-2001) Growth Factor
Sex Ratio
Sex ratio is defined as the number of females per 1,000 males in the population. It is an important indicator to measure the extent of prevailing equity between males and females at a given point of time. It may be noted that India still has a low sex ratio of 933 females per 1000 males in 2001. In 1991, the sex ratio was 927. There has been a slight improvement, but compared to other countries the situation is disappointing. Important reasons to analyze sex ratio are to throw light on issues like neglect of the girl child; high maternal mortality; sex-selective female abortions and female infanticide. The tiger country is no exception but for Kerala and Pondicherry (shown in light green in Figure 4) where the sex ratio is just greater than unity (1058 and 1001 respectively).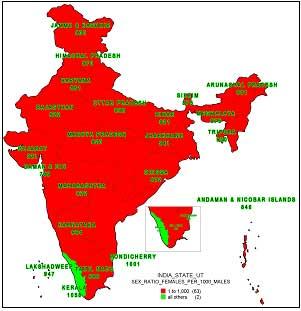
Figure 4: Sex Ratio (2001)
Delhi is in such a sorry state of affairs with a sex ratio of 821 females per thousand males. Who knows? The recent events in the capital city that have tarnished the pro women image of India in the international society could be an indication of this skewed sex ratio. Instead of merely blaming female foeticide, a host of social, health and environmental factors need to be brought under the microscope, if the skewed sex ratio has to be set right.
Literacy
Literacy is an important indicator of social development. A person who can read and write with understanding in any language is treated as literate. A quick analysis of the states of India using GIS shows that Kerala tops with 90.92 percent (Figure 5). But an analysis of the female literacy rate shows that in some of the states female literacy is not even close to fifty percent. A classic example is Bihar whose history boasts of seat of knowledge like Nalanda University however has an overall literacy of only 47 percent with a female literacy rate of 33 percent.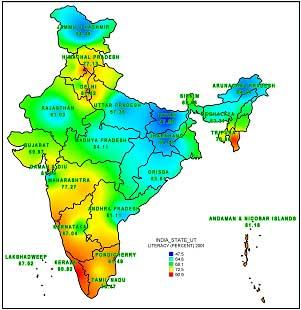
Figure 5: Literacy Rate (2001)
A quick thematic analysis to see if atleast 50% of the females are literate shows that out of 35 only 28 pass the 50 percent mark (shown in light green-Figure 6) and in 7 states/ union territories (shown as red in Figure 6) less than 50 percent of the females are literate. It is necessary to increase the female literacy rate for several reasons including better population control, increased female life expectancy, better childcare etc.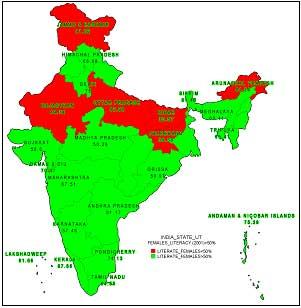
Figure 6: Female Literacy Rate (2001)
Urbanization
Urbanization is the increase in the proportion of people living in towns and cities. Urbanization occurs because people move from rural areas (countryside) to urban areas (towns and cities). Rural to urban migration is happening on a massive scale due to population pressure and lack of resources in rural areas. These are critical 'push' factors. The rapid pace of urbanization is inescapable and irreversible. It demands for increased utilization of the limited infrastructure in the cities. Failure to make note of this could lead to the break down of various infrastructure facilities, civic functions and depletion of natural resources like ground water in the cities. Delhi tops the list in terms of urbanization at 93.01percent. A grid thematic analysis clearly shows the urbanized areas by red spots (Figure 7).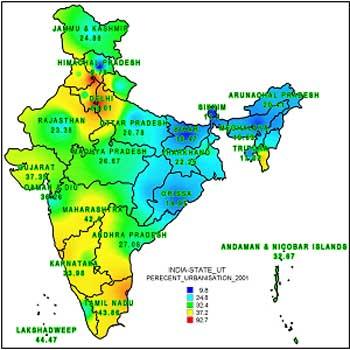
Figure 7: Urbanization (2001)
Conclusion
Well we did hear what India had to tell us in the language of GIS on its state of affairs. The list of such GIS analysis in planning is really endless. GIS could not only be the possible key to unlock the latent problems in our cities and in our planning techniques but also the “key to unlocking a nations potential”. GIS could be the mirror that could reflect the state of the people contained in the cities of India. How they live? Where they live? What they do? More importantly the quality of life in the cities. GIS may not be the paragon of all virtues but it could be important as one of several measures for addressing the problems confronting the urban planners of today.
Of what use could be any technology if it cannot reach and benefit the common public suffering in the veritable concrete jungles, the so-called cities and the remote villages of India? It is a pity that it is not the people of the country who are starved but our planners and decision makers who are starved for want of information.
Multiplicity of institutions and duplication of data at various levels have marred the desired results. Most of the time is spent in making one department or the other as the scapegoat when the plans fail to give the desired results. Let us not get mired in history and "throw out the baby (GIS) with the bathwater". Constructive and creative suggestions are the need of the hour. Let us work towards finding ways and means of applying GIS for urban problems in a rational and a logical way.
Let the common man talk to our cities in the language of GIS. Let the common man understand what our cities, towns and villages have to say them. Let us empower them with Geospatial Democracy. Let them decide what the priorities are and let them make meaningful choices! A final thought: Let us empower the hoi polloi with the fundamental right to Geospatial Democracy before we hear the hoi polloi say: “Geospatial Democracy is my birth right and I shall have it !”
Thanks to Census of India for the data


No comments:
Post a Comment