Keep watching as to what this Saint GIS has to say about the Geographical Information Systems (GIS) and his favourite Spatial ETL tool FME (Feature Manipulation Engine). He calls himself Saint GIS, know why? In his world of GIS; GIS file formats do not matter! Anything to do with data and maps/GIS as long as it is using FME
Wednesday, March 06, 2019
The Mapophobic to Mapophilic Transformation
MapQuest founded in 1967 as a cartographic services division of R.R. Donnelley & Sons launched online maps, the web services version of present day in 1996. MapQuest is still one of the most widely used online mapping services. Google’s findings in 2004 that over 25% of its searches were of a geospatial character, including searches for maps and directions laid the foundation for its acquisition of Keyhole, the core technology behind Google Earth. Later in 2005, Google Maps was launched, which first started as a C++ program designed by two Danish brothers, Lars and Jens Eilstrup Rasmussen.
Where are we?
Thanks to web & mobile based global online map services such as Google Maps, MapQuest, Open Street Maps and Bing Maps to name a few, for having revolutionized the reach of maps. We live in interesting times, where maps are the order of the day. From daily commute to work, holiday planning to exotic places, shortest routing for emergency response, catastrophic natural disaster preparedness & relief, strategic planning to global warming, maps are used everywhere. There is a lot more awareness about importance of location intelligence and Geographical Information System (GIS). People are no more phobic to maps but philic. Maps, location intelligence and GIS are becoming part of our everyday lives sometimes even without us being aware!
The power of location intelligence is of more importance than ever for businesses of this age. Location intelligence is the main stay of several disruptive innovations of today and continues its key position in futuristic disruptive technologies such as Internet of Things (IoT), Artificial Intelligence (AI), Machine Learning (ML), Unmanned Aerial Vehicle (UAV), Augmented Reality (AR), Spatial Augmented Reality (SAR), Virtual Reality (VR), Autonomous Vehicles (AV), Computer Vision (CV) etc.
The Challenges
With mobile/connected devices becoming ubiquitous today, the amount of location data generated is enormous. Ever growing location intelligence based disruptive innovations and platforms together with disruptive technologies are proving to be the key differentiator to businesses to improve customer experience, drive revenue and increase operational efficiency. Disruptive technologies like IoT, AV, CV, UAVs etc. are delivering information that has never been possible before, creating entirely new avenues for geospatial data collection, while posing challenges for geospatial data storage, retrieval and analysis. Location-based analytics and platforms that can process and detect trends and provide intelligence are becoming more popular. This has resulted in greater adoption of cloud-based platforms for enterprise GIS deployment involving big data.
Gartner, Inc. had forecast that 8.4 billion connected things to be in use worldwide in 2017, 110 percent of the world population estimated at 7.6 billion as of April 2018, up 31 percent from 2016, and predicted to reach 20.4 billion by 2020.
Big data is all about the notorious five Vs: Volume, Variety, Velocity and Veracity. With disruptive technologies based location intelligence innovations and platforms growing day-by-day, the big data and cloud computing industry are faced with the challenge of geospatial big data capture, storage, analytics, visualization and reporting (dissemination). Besides the typical challenges posed by the five Vs of big data, geospatial industry continues to be trapped in the ever growing matrix of not just GIS data formats and data types but also of non-geospatial nature.
Every Cloud has a Silver Lining
Disruptive innovations and platforms that generate and or consume geospatial big data, quickly reach criticality, where there is so much of (big) data that they are either unable to handle or do not know what to do with them. In this context ETL (Extract-Transform-Load) platforms and specifically Spatial ETL platforms have been the silver lining to the dark data format and data type clouds shrouding the geospatial (big) data industry. Incompatible systems are a thing of the past with Spatial ETL platforms, providing native support for location data, including the complexity of GIS, Computer Aided Drafting (CAD), Building Information Model (BIM) and latest big data eco-systems such as Hadoop. Spatial ETL platforms such as Feature Manipulation Engine (FME) from Safe Software provides the much needed geospatial (big) data conversion-transformation-share-integration along with geospatial analytical capabilities. Such Spatial ETL platforms are already available on the cloud such as Amazon AWS.
History of Big Data traces its first explosion to 1940s; the earliest documented use of the term “information explosion”, nevertheless geospatial data has always been Big Data. Despite challenges posed by Big (Geospatial) Data, it has the potential to improve operations and make quicker and intelligent decisions. Big (Geospatial) Data when converted, transformed, shared and or integrated appropriately using cloud based Spatial ETL platforms, can help organisations gain useful insight to increase revenues, better manage their assets and improve operations geospatially, in a BIG way!
This article was originally written by this author for Insights Success Magazine October 2018
Wednesday, March 30, 2016
Small Things of Big (Geospatial) Data
The history of Big Data traces its origin to 1940s; the earliest documented use of the term “information explosion” and today we have Big Data explosion in geography (geospatial data).
Big data is a broad term for data sets so large or complex that traditional data processing applications are inadequate (Wikipedia). Paleolithic petroglyphs to modern data centers, the human race has always dealt with information. With technology innovation, Moore’s law is becoming irrelevant and Parkinson's Law of Data; “Data expands to fill the space available for storage” is resulting in information overflow or so called Big Data.
The world of Big Data is unfolding dramatically right before us from the amount of data being generated to the way in which it is structured and used. Despite the ever growing interest on “Big Data”, we surprisingly hear little about “Big Geospatial Data.” Nevertheless geospatial data has always been “Big Data”. Thanks to the advancements in geospatial data collection or acquisition such as satellite, remote sensing, global navigation satellite systems, aerial surveys using photographic / digital cameras, sensor networks, LiDAR and now Internet of Things (IoTs), is leading to exponential growth in volume of geospatial data. Big (Geospatial) Data exceeding capacity of current computing systems, presents its own set of opportunities and challenges. Examples of Big (Geospatial) Data include, but not limited to earth observation data, sensor data, location information, spatio-temporal data; which are key inputs for real time monitoring and management class of geospatial applications.
Organisations that generate and or consume geospatial data, suddenly find themselves swimming in so much data that they don't know what to do with them, besides faced with challenges such as capture, query, analysis, visualization, and dissemination of this data.
Contrary to the notion that Big (Geospatial) Data is just about handling lot more data (both structured and un-structured) requiring sophisticated data storage systems, organisations embracing Big (Geospatial) Data fail to take note that, it is also about handling
Volume: unprecedented growth in data volumes
Velocity: rapid increase in the velocity or speed of data creation (generation)
Variety: extension in the variety of data types to be handled
Big (Geospatial) Data is more specifically concerned with the advancing speed in which new information, from an increasing number of diverse data sources and types, confront organisations trying to embrace Big (Geospatial) Data.
As with any Big Data, the three V’s: Volume, Velocity and Variety are the critical challenges with Big (Geospatial) Data as well. With efficient handling of these three V’s or “Small Things of Big (Geospatial) Data”, organisations embracing Big (Geospatial) Data is sure to reap the full benefits.
With FME (Feature Manipulation Engine), the industry standard in spatial data transformation technology, from Safe Software Inc., Canada you are in “Safe” hands for a reliable handshake with the ever growing Big (Geospatial) Data universe.
Volume: With support for several Big Data applications, FME eases the process of migration of voluminous (Volume) legacy or existing data of different types and models from/ to Big Data services or solutions.
Velocity: There is so much of geospatial and non-geospatial data today available for use immediately or in real time as soon as it is collected. In order for such real time data to be of any use, it requires suitable systems in place, to handle the advancing speed in which new information floods the system, from an increasing number of diverse data sources and types. FME’s real-time processing functionality has the ability to immediately respond to events and trigger different FME actions to ensure real-time data is delivered exactly how it's needed in actual real-time.
Variety: FME’s exceptional data conversion, transformation, integration, validation and migration capabilities together with support for 345+ data sources such as BIM/ CAD/ Database/ GIS/ LiDAR/ Raster/ Vector/ Web/ XML/ Sensor file formats and data model barriers; can help organisations solve Big (Geospatial) Data challenges with ease.
With one powerful integration engine and three ways to deploy: FME Desktop, FME Server and FME Cloud, keep ahead of evolving Big (Geospatial) Data, while addressing the three critical V’s or “Small Things of Big (Geospatial) Data”. While FME Desktop lets you connect and transform data in limitless ways, FME Server provides enterprise-level access to FME's powerful capabilities. FME Cloud is the hosted version of FME Server with no hardware required.
Despite several challenges posed by Big (Geospatial) Data, it has the potential to improve operations and make quicker and intelligent decisions. Big (Geospatial) Data when converted, transformed, shared and or integrated appropriately using a platform like FME, can help organisations gain useful insight to increase revenues, better manage its assets and improve operations geospatially, not just in a BIG way but also in a “Safe” way!
Wednesday, March 23, 2016
Geospatial Intelligence: The “Safe” Way
The ability of GIS to add spatial perspective to any data being analysed or monitored is the key to geo-intelligence. “Data is Power” and a key component that drives any geo-intelligence solution. Thanks to sensors and IoT (Internet of Things), big data is now a reality: the volume, variety and velocity of data coming into any geo-intelligence system continue to reach unprecedented levels.
Geo-intelligence is about timely collection, exploitation and analysis of geospatial data, including sensor data, imagery etc to maximise operational capabilities, assess risk and informed decision-making. “Right Information” at the “Right Time” in the “Right Form”
Many a time, at the critical hour, when the need is for a common operational picture the intelligence agencies end up with GIS interoperability issues not just against GIS file formats but also against real time information from sensors and IoTs. GIS interoperability is the ability to integrate or exchange information between different components of any geospatial (intelligence) solution, even though different agencies are on different GIS platforms and therefore file formats and data models.
GIS interoperability has long been a burning issue in the geo-intelligence community. For years geo-intelligence users and decision makers continue to maintain data locked up in some proprietary format until the gloomy cloud of interoperability issue suddenly snuck out from nowhere and its dark shadow descends over when the nation is under threat or a disaster strikes. A nightmare scenario, but for this digital alchemy: FME from Safe Software Inc., Canada, the industry standard in spatial data transformation technology.
Geo-intelligence community is an always connected world and FME’s data conversion, transformation, integration, validation and migration capabilities can not only empower this community to overcome 325+ CAD/GIS/Database/Web/Sensor file formats and data model barriers but also solve day-to-day data interoperability challenges.
With FME Desktop, FME Server and FME Cloud, keep ahead of evolving sensors or IoT technology and the ever increasing quantity of disparate data types to integrate and instantly make use of urgent intelligence. Increase operational efficiency by removing data integration problems. Build situational awareness by collecting, filtering, and analyzing information from vast data volumes to effectively identify threats and share critical knowledge. Make sense of your sensor data with FME to derive useful, actionable information from sensors with FME's ability to read and process sensor messages, analyze them and identify significant events, then execute appropriate responses to these events, all automatically and in real or near real-time.
FME Server is a complete sensor data processing solution that enables users to productively overcome all of the complications associated with utilizing sensor data. FME technology supports data transformation and integration between JSON, XML and CSV- the most common formats for raw sensor messages - and hundreds of other data types and applications, enabling you to use sensor data effectively with other data and in any system you need. Accomplish complex analysis with sensor networks, alert people and systems of sensor events in real-time, connect to sensor data management platforms and maximize the value of sensor data with FME.
With sensors in your own pockets, no matter whatever be the sensor data or GIS file formats that you handle, the only time GIS interoperability could be fun, is when you make peace with GIS file formats and sensor data using FME!
Thursday, February 26, 2015
Writing to CartoDB using FME: My first CartoDB visualization
Availability of schooling facilities in habitations at primary level as on 30th September 2009 using data from data.gov.inInspired by the new Writer for CartoDB in FME 2015 from Safe Software (www.safe.com), here is my first CartoDB visualization based on data from data from data.gov.in portal of Government of India under NDSP on availability of schooling facilities in habitations at primary and upper primary stages as on 30th September 2009
Monday, September 08, 2014
Mr M.Krishnan's-Thirumullaivoyal house in Google Earth 3D
Tuesday, June 25, 2013
Himalayan Tsunami 2013-Uttarakhand Flood Calamity 2013,India
Google Earth tour of some flood ravaged areas
This Google Earth project is dedicated to those pilgrims and tourists whose lives were lost in the recent floods (June 2013) in the State of Uttarakhand, India
This is a tour of some flood ravaged areas.
More information on Uttarakhand:
http://en.wikipedia.org/wiki/Uttarakhandhttp://www.uk.gov.in
RESCUE & RELIEF OPERATIONS WEBSITE
http://164.100.150.41/rescuenreliefGoogle Person Finder-2013 Uttrakhand Floods
http://google.org/personfinder/2013-uttrakhand-floods/Monday, September 05, 2011
Web GIS for Public Health
- Importance of public health research,
- Current trends in the field of GIS, especially Web GIS
- GIS Applications in Medical Geography – Tools & Technologies,
- Spatial Epidemiology: Current Trends and Future Challenges
~ SRG
Saturday, December 18, 2010
GIS based Donor Information System
Phone calls to friends and relatives with a great deal of anxiety are quite common during medical emergencies arising out of accidents or illness or other such medical conditions. Any help from unknown quarters comes as a big relief. But one is often caught scrambling during such critical times for much-needed information, the information regarding donors.
It is needless to emphasize the plight of those looking out for blood donors especially of rare blood groups during such medical emergencies. If such is the situation with information on blood donors, imagine the nightmare of those looking for information on donors of other types such as bone marrow, kidney, liver, lungs, eyes etc not getting the required information at the appropriate time. Everyday thousands of lives are lost for want of such critical information at the appropriate time. When lives are at stake, every second counts and words cannot describe the plight of the near and dear ones, running from pillar to post in locating the donors.
Geography or GIS for that matter has never been so closer offering a helping hand in our day-today life. Web based and even GIS based blood bank/ blood donor information systems are already the order of the day. But for some reason the concept has not extended beyond blood banks and blood donors into other types of medical donors like eye, kidney, bone marrow, lung, liver donors etc. and corresponding donor banks/ facility.
“Brain death” something hitting the headlines these days refers to the irreversible end of all brain activity (including involuntary activity necessary to sustain life) due to total necrosis of the cerebral neurons following loss of blood flow and oxygenation. Brain stem death (not whole brain death) is taken to be the significant indicator of death. Brain death may result in legal death, but still with the heart beating, and with mechanical ventilation all other vital organs may be kept completely alive and functional, providing optimal opportunities for organ transplantation. Most organ donation for organ transplantation is done in the setting of brain death. In some nations (for instance, Belgium, Poland, Portugal and France) everyone is automatically an organ donor, although some jurisdictions (such as Singapore, France, or New Zealand) allow opting out of the system. Elsewhere, consent from family members or next-of-kin is required for organ donation. (Source: http://en.wikipedia.org/wiki/Brain_death).
With the success of organ transplantation as an effective modality of treating end stage disease of various organs, increasing numbers of organ transplants are being performed all over the world. However, this procedure requires a “donor” pool of either “living” or “cadaveric” donors. Since this pool is limited, the gap between “demand” and supply is widening, which is further hampered with the non-availability of information regarding this limited donor pool at the right time. In the context of organ donation “cadaveric” donation has largely meant “brain dead” or “heart beating” donors. Such cadaver organ donation no doubt requires a robust IT/GIS based operational support system as its backbone to effectively utilize such cadaver donors.
A final thought: For a moment let us close our eyes and imagine the plight of the near and dear ones scrambling for information on donors, during medical emergencies. How thoughtful it would be if a donor registered for eye donation breathes his last and a SMS with the donor ID to a centralised server with details regarding the place, date and time of death etc is dispatched by the kith and kin of the deceased. This SMS then triggers of a set of GIS analysis on the server based on parameters such as the list of recipients registered in the vicinity of the donor considering medical factors for organ donation along with the spatial separation between the donor, recipient and the transplantation facility. The end result is an alert to either to the recipient/ care taker/ medical facility with location details of the donor.
A new concept such as this GIS based donor information system definitely needs inputs and support from all quarters and needs to be experimented, given a deep thought to put in practice.
The donors may be living or cadaver, their hearts beating or not beating, but let our hearts beat as one for a GIS based Donor Information System!
Can GIS Save Lives?
Medical geography aka health geography, is an area of medical research that incorporates geographic techniques into the study of health around the world and the spread of diseases. It also includes studies on the impact of climate and location on an individual's health as well as the distribution of health services. Medical geography is an important field because it aims to provide an understanding of health problems and improve the health of people worldwide based on the various geographic factors influencing them. Health geography is the application of geographical information, perspectives, and methods to the study of health, disease, and health care (Wikipedia)
During the times of the Greek doctor Hippocrates (5th-4th centuries BCE), people have studied the effect of location on one’s health. For example, early medicine studied the differences in diseases experienced by people living at high versus low elevation. It was easily understood that those at living low elevations near waterways would be more prone to malaria than those at higher elevations or in drier, less humid areas (geography.about.com). Though the reasons for these variations were not fully understood at the time, the study of this spatial distribution of disease for sure was the beginning of medical geography. It was not until middle of 18th century when the cholera epidemic gripped London that medical geography gained significance.
During the last three decades, a powerful technology has quietly changed the way people view and live in their neighborhoods, towns, and cities. Most people remain unaware of GIS and its impact-an impact that is as far-ranging as it is useful-despite GIS having grown immensely in the last 15 years, despite hundreds of thousands of people now using the technology, and despite it affecting the daily lives of millions (ESRI).
Be it the pandemic killer swine flu or AIDS of the 20th century, the super power of GIS is its ability to add a spatial perspective to any data being analysed. This has always proved to be very useful to epidemiologists across the globe in elucidating patterns and relationships between the person, place, and time components of epidemiologist data. In addition, GIS technology has been an important tool for understanding and displaying disease or disease risk that are related directly to environmental exposure.
Today, medical geography has a number of applications as well. Since the spatial distribution of disease is still a large matter of importance, with GIS based maps playing a significant role in this field. Google Maps in the recent years has revolutionized the way in which information on several epidemics/ pandemics like swine flu, flu (Google Flu Trends) is delivered to general public.
The Center for Disease Control and Prevention (CDC) in the United States for instance uses what they call the Atlas of United States Mortality to look at a wide range of health factors across the U.S. Data ranges from the spatial distribution of people at different ages to places with the best and worst air quality. The World Health Organization (WHO) features health data for the world with its Global Health Atlas. In India NATMO (National Atlas and Thematic Mapping Organisation) prepares Health and Diseases Atlas for India besides other organisations.
A final thought: For a moment let us close our eyes and imagine the plight of our human race threatened with a plethora of heath related issues in this 21st century. Of what use could be any technology if it cannot reach and benefit the common public suffering in the veritable concrete jungles, the so-called cities and the remote villages of India? It is a pity that technologies such as GIS and many such applications do not see the light of the day, for one reason or the other. Let us explore ways to apply GIS to make our lives better!
Now, Can GIS save lives? The answer is: on the lighter vein, GIS has been my bread winner for several years now. GIS may not be the paragon of all virtues but it could be important as one of several measures for addressing the problems confronting the epidemiologist and the medical community in saving the human race, if applied in the right manner, at the right time.
Sunday, July 16, 2006
Broadening the CAD-GIS horizons
Broadband is the marriage of telecommunications and cable technologies. As it is rightly said, “Necessity is the mother of invention”, the last decade saw tremendous advancements in the arena of digital and fiber optic technologies: key elements empowering the broadband technology. Broadband technology has not only given a new meaning for information exchange, but has also been the building blocks for the so-called “Information Superhighway”. Besides fostering a new class of consumer and business related services such as IP based telephone and video conferencing services, Video On Demand (VOD), home networking etc., it has also resulted in increased cable modem penetration and deployment of cable telephony services, making cities digitally intelligent.
Broadband technology besides being looked upon as an innovative technology, as a tool to make the city residents digitally literate, competent and proficient, it is also being looked upon as an “always-open gateway” to a new world of telecommunications and cable technologies and as the buildings blocks for the so called “Information Superhighway”, expected to dictate the economic development of the cities of the third world.
NEED FOR GIS IN BROADBAND INDUSTRY
As with most utilities, cable companies traditionally create and maintain detailed paper maps of their systems (network and equipments). In the last decade these paper maps became increasingly generated and stored using CAD and rarely did these MSO’s employ the software for tasks beyond simple drafting. In other words the CAD technology was merely used to create an image for the purpose of engineering documentation, whilst maintaining key data in disparate spreadsheets and other databases to manage their key assets.
With the tremendous pace at which the broadband infrastructure is being deployed and given the ever-growing consumer needs, the cable and broadband companies are at crossroads. Moreover these systems expand geographically and functionally every day. The realities of this new paradigm have made obsolete, the manual, non-integrated approach to asset management, network monitoring and customer care that characterized the cable industry’s simpler past. In the absence of a comprehensive out-of-box solution in place and faced with the competitive realities, the cable companies are finding it difficult to not only manage the increasing volume of CAD documents associated with such network systems, but their real assets on the field as well. The engineering departments rely on system maps painstakingly drawn by drafters and residing in legacy CAD/Database combination files, paper maps, disparate spread sheets and other such formats, thereby making their enterprise wide usage redundant. By virtue of the manner in which such critical cable plant network data is maintained and managed, quicker and accurate decisions are next to impossible.
It is in this context that GIS finds importance in not only giving asset management a new dimension with the ability to handle geospatial data but also in revolutionizing the way in which such key assets are managed. In the recent years the trend has been to integrate geospatial and asset management systems to provide the most natural and effective links in utility information management and this synergy has been quite evident. Awakened by the shortcomings of the CAD/Database combination approach of the existing legacy systems to maintain key network element information and faced with the competitive realities, it seems quite logical to apply geospatial technology for a solution to this crisis.
GIS BASED BROADBAND AM/FM UTILITY GIS – WHAT IS IT?
PIXEL has been serving the Broadband/ Cable industry for the past 12 years and this rich experience along with its skilled in-house GIS team has gone into developing this GIS based Broadband Information System to address the key issues confronting such systems like: Network monitoring & Optimized Efficiency in Service, Ability to take Quicker and Accurate Decisions, Better Asset Management etc. A web based GIS for cable TV operators and other utility companies is a linkage of databases and maps, thereby creating a searchable interface that includes the simplest functionalities like zooming and panning to the sophisticated ones like printable reports and completely searchable and locatable network elements. Applying GIS for the Broadband industry will not only help the industry migrate their cable plant data from their existing obsolete legacy CAD/ Database systems to a web based GIS system but also derive enterprise wide benefits, effectively manage their assets, avoid intelligence redundancy and have the information about their assets at their finger tips. PIXEL though this article shares its years of rich international and domestic experience in the HFC/ Broadband industry both in the design and GIS creation.
THE CATV HFC WORKFLOW
A typical CATV (Cable TV) network map starts with a field walkout collecting the addresses to be served and verifying them. This is followed by what is called a STRAND MAPPING. Strand Mapping is a graphical representation of Broad Band network routing. Data collected through field walk is drafted on CAD software, which forms the base for Broad Band network design. This is followed by a Node layout based on the HFC architecture deciding the number of homes passed. Then the actual RF Network design and or Fiber design is done. There are several combinations in this Broadband architecture depending on the actual devices and systems used. In places like Manhattan in New York, there are FTH connections or what is called as Fiber to Home.
MIGRATING CAD DATA TO GIS
Intelligent graphics and data binding between the graphical elements on a map and its corresponding information in a database is the essence of any GIS system. Deploying GIS for the Broadband industry is with the intention to enable the Broadband, Coaxial, Fiber and other network element information data of cable companies residing in legacy CAD/Database systems accessible to its users enterprise wide via corporate intranet or the World Wide Web. The first and the most challenging step for PIXEL was to perform spatial & attribute data mining and migration from the traditional CAD/Database format combinations to a user friendly, cost effective and easy to use GIS format.
To avoid GIGO (Garbage In Garbage Out), before the process of mining the data from the traditional systems, PIXEL does what is known as data scrubbing and validation. In this process the key information based on the nature of the queries and reports required for a MSO, is filtered out. The inaccuracy and inconsistency of the data is brought to the attention of the MSO and appropriate action taken before taking it up for data migration. The input data for migration to any standard GIS or more complicated systems like GE Smallworldâ is run through several processes checking for the database integrity, signal levels, engineering design consistency, design and drafting errors etc. before the files are sent for migration to GIS. This is necessary and a critical process in the life cycle of the project, due to the inconsistencies that creep in during the drafting and design processes of these files that are carried out not by one contractor but by several of them. In some instances due to technological limitations at the time of data migration many of the system maps are unintelligent. These are made intelligent by a skilled in-house team either by manual or semi-manual drafting and design processes. Another obstacle in the path of CAD-GIS migration was the multiplicity of CAD formats like Bentleyâ’s MicroStation, AutoCADâ etc. and databases like Oracle, dBase etc. in which the spatial and attribute data respectively to be migrated resided. Thanks to FMEâ(Feature Manipulation Engine), powerful spatial data translation and transformation software from Safe Software, Canada. With the aid of custom-made mapping files designed in house, the data mining is done at various levels to migrate the unintelligent or relatively less intelligent data into a more intelligent piece of geospatial data. This is essential to enable the network elements to be completely searchable in a web based GIS environment satisfied by virtue of the carefully designed data model and layer structure.
FMEâ, the spatial ETL (Extract, Transform and Load) tool from Safe Software, is a Swiss Army knife in terms of cutting across the CAD-GIS migration barriers and in handling multitude of CAD/GIS file formats in the industry. It is the neutral CAD/GIS environment of FME that adds power and giving it an unique edge in the interoperability industry. Over 170 plus CAD/GIS formats as on date are interoperable through FME. PIXEL’s experience in the CAD/GIS industry suggests that many a time the network and landbase data in popular CAD formats are prone to simple design and drafting errors to more complex ones like database integrity, inconsistent signal levels between network elements/ equipments, engineering design inconsistency etc. There have been always these issues of the landbase over which the Broadband network elements are drafted and designed getting outdated or requiring a datum shift from say NAD27 to NAD83 systems in a typical United States system. Most of the data though available in CAD formats, either are not suitable for a direct GIS migration by virtue of the file formats or prone with drafting errors like overshoots, undershoots, snapping errors. All of these require a thorough data scrubbing. PIXEL’s in-house team does most of these through its custom in-house data scrubbing tools or using FME.
The next task was to make this intelligent piece of network information available for enterprise wide use and to provide the end users at various levels with the appropriate tools and interface for querying, report generation and other such routine tasks relating to the cable industry. Along with the appropriate development tools, based on our experience with some of our most prestigious cable MSO’s and understanding of the key end user requirements, an appropriate web GIS interface has been developed to make the most out of GIS.
Broadband AM/FM Utility GIS
Beyond making intelligent network maps available for enterprise wide use, GIS as evident has other features that can be used for network operations, field engineering, marketing & sales and engineering purposes. To quote a few:
The Network Operations Center (NOC) could use GIS for trouble ticket dispatch at a quicker pace with no more rummaging through cumbersome paper maps or Run a trace to locate the fiber cut for service restoration or Quickly highlight the consumers who will be affected from an outage, so that the alternative measures could be planned.
The Engineering department can plan before they dig up, as the network plant data is made available overlaid with appropriate GIS landbase layers in GIS. The engineers can locate any piece of network element like amplifiers, power supply, cables etc. The customer addresses can be clicked to get information like what type of cables run to it? Where is the feeding amplifier? Which node is it connected to? How many houses are wired to the same network? Where are they? and so on. Quickly generate engineering inventory reports like the total cable footage, house counts, count of specified pole types within a given service area and so on.
The Accounting department for the inventory report on its valuable assets out in the field could simply pick the fields on which they wish to generate the reports or do franchise fee calculations, weekly or monthly field inventory statements etc.
The Marketing and Sales department could locate their “Best Customers” based on specific criteria and this could be for their proposed service area or could be within the existing ones. This could also be to identify the “Best Business” location or to identify areas suitable for reference or direct advertisement.
GIS for Broadband also offers a wide range of scope to integrate GIS system with other existing Work Management Systems (WMS) at various levels.
INTEGRATING WITH WORK MANAGEMENT SYSTEMS
Integrating GIS with other systems increases its value proposition and gone are the days of a standalone GIS system. By integrating such GIS based systems with other work management systems, one can get a wider range of benefits. Work management systems could be anything from a market analysis system to an outage management system or a bandwidth management system. By using powerful Geocoding tools the non-geospatial data associated with such systems can be tied to an appropriate spatial entity in the existing geospatial network data in GIS. This not only allows for an opportunity to visualize the non-geospatial data associated with such systems, but to also display the output from such systems on an intelligent GIS map. As an example the output from an outage management system could be used to display the trouble ticket location at the appropriate zoom level with other GIS layers on a GIS map. In most cases the existing outage management systems or any other work management systems for that matter lack such an interface leaving the decision makers with no choice other than a rugged display of the output from such system. There can be no doubt on the ability of GIS to discover existing dormant relationships between various entities. Moreover in the case of existing work management systems, they are discrete and this makes it impossible to bring valuable information in a timely manner. The role of any AM/FM GIS system for that matter would be to tightly integrate these systems and provide the users with the ability to view all the critical components of their operations processes at the click of a button.
Of all creatures, humans are the only ones who can ponder over and understand a situation and the only ones who can think up ways of doing something about a problem in a rational and logical way. GIS may not be the paragon of all virtues, but it could be important as a tool for addressing key problems and rudimentary processes of the Broadband industry. Building the “Information Superhighway” with the Broadband technology to improve economic development, make city residents digitally literate and the cities intelligent is a mammoth task and with GIS, “Broadband bandwidth that is used to access such GIS is not the limit” but "Sky is the true limit!”
Tuesday, July 19, 2005
India: I Speak GIS
With the enactment of Freedom of Information Act, 2002: An Act to provide for freedom to every citizen to secure access to information under the control of public authorities, consistent with public interest, in order to promote openness, transparency and accountability in administration and in relation to matters connected therewith or incidental thereto.
The people of our country now therefore have a right to their own views, to promote them in informed discussions, demand transparency in government, and to offer criticism without fear. The courts have repeatedly affirmed these, but the quest to realize them is far from over. The position pretty much clearly established in law, there is little doubt that information is not as free as scientists or other common citizens would like it to be. With reference to GIS, there are mounds of information to which the general public are still denied access. Maps of numerous areas are restricted beyond a particular scale. Given this situation, how do we expect the basic tenets of our democracy to put forward their views in the absence of GIS literacy and lack of geospatial democracy? Most government sector agencies do not understand the value of their data, and either do not release it or do not know how to price the data.
The objective of this paper is:
To create awareness on the need to integrate GIS into our daily planning activity at various levels.
To show how GIS can effectively analyze different demographic and development indicators of India at state level and arrive at conclusions.
To show that “GIS holds the key to unlocking a nations potential” and Geospatial Democracy is the need of the hour.
Urban planning & GIS – an overview
Planning is a future-oriented activity that links "scientific and technical knowledge to actions in the public domain. It happens through a public discourse between all groups and individuals interested in and/or affected by urban development and management activities pursued by the public or private sector. Planning-related decisions are made daily through a complex, often politically charged process involving plurality of interests. Moreover, the implementation of those decisions makes a long-term imprint on the urban structure, functionality, and quality of life in urban environments. While most of urban and regional planning happens at the local level, national and state policies and legislation often influence planning activities.
Role of GIS
The demographic and other development indicators for a planning area may be available in different forms such as paper maps, photograph, textual, graphical or tabular form to the planner. Integration of these multifarious data and their analysis is a tedious, time consuming and a real Herculean task for the planners. Moreover basic things like preparation of base maps by traditional methods take away the time and resources of planners, leaving little or no time for an elaborate analysis of the data collected in an effective manner.
It is in this context that GIS find importance as a tool to enhance their analytical, problem-solving, and decision-making capability of the planners. From the late 1950s planners started to develop and use computerized models, Planning Support Systems (PSS), Planning Information Systems (PIS) and Decision Support Systems (DSS) to improve performance. Adoption of Geographic Information Systems (GIS) is a more recent manifestation of the same effort to incorporate new tools and technologies.
India: the tiger speaks GIS
One who visits India for the first time is sure to be enthralled in its vivid kaleidoscope of landscapes, magnificent historical sites and royal cities, golden beaches, misty mountain retreats, colorful people, rich cultures and festivities. But for the hoi polloi, who else could say if the harsh realities, problems and paradoxical situations confronting them, have been hidden behind the tall skyscrapers and in the veritable concrete jungles of the cities of India.
To understand the current state of affairs in various states of India and to demonstrate how GIS can be effectively used in planning, few demographic data and development indicators like:
Population
Population density
Sex Ratio
Literacy and
Urbanization
at state level have been taken up for analysis.
Let us hear the fascinating story that the tiger country: India has to speak to us in the language of GIS.
Population
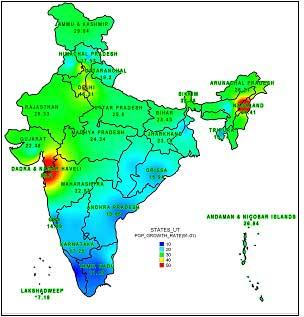
The total population of India as at 0:00 hours of 1st March 2001 stood at 102,70,15,247 persons. In terms of population it became only the second country in the world after China to cross the one billion mark. At the state level, Uttar Pradesh tops the list with a total population of 16,60,52,859 persons, followed by Maharashtra. Interestingly a grid thematic analysis (Figure 1) of the population growth rate (1991-2001) using GIS throws more light on the fact that Nagaland which is in the twenty fifth place in terms of total population however comes first in terms of the growth rate, with Delhi in the fourth place. The red spots in indicate a population growth rate of over 50% between 1991-2001.

Figure 1: Population growth rate (1991-01)
Population Density
An important index of population concentration is its density measured as number of persons per square kilometer.
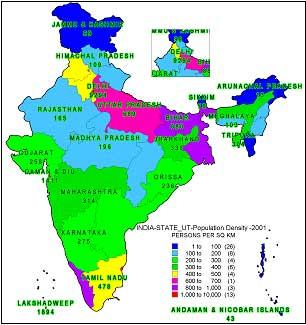
According to world development report (2000-01) of World Bank, the world average is 46 persons per sq km and for low-income countries the average is 73. A thematic map (Figure 2) using GIS shows that Delhi tops with 9294 occupying one square kilometer area. Population density is a good indication for overcrowding especially in cities
Figure 2: Population Density (2001) Persons per Sq. Km
A dot density thematic of population density growth factor between 1991 and 2001 (Figure 3) shows the drastic change in the density in Delhi and adjoining states where the growth factor is over 1.25 as evident from Figure 3. In Delhi about 3000 more people are occupying the same space in 2001 as compared to the year 1991. As the density of population increases the need for infrastructure increases. A case of expanding population and finite resources, calls for population stabilization so that undue pressure is not put on its natural resources to support the rising population.
Figure 3: Population Density (1991-2001) Growth Factor
Sex Ratio
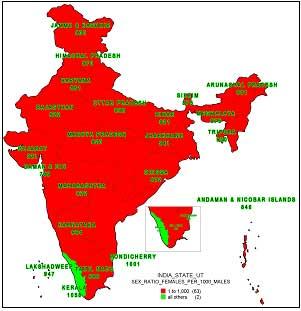
Sex ratio is defined as the number of females per 1,000 males in the population. It is an important indicator to measure the extent of prevailing equity between males and females at a given point of time. It may be noted that India still has a low sex ratio of 933 females per 1000 males in 2001. In 1991, the sex ratio was 927. There has been a slight improvement, but compared to other countries the situation is disappointing. Important reasons to analyze sex ratio are to throw light on issues like neglect of the girl child; high maternal mortality; sex-selective female abortions and female infanticide. The tiger country is no exception but for Kerala and Pondicherry (shown in light green in Figure 4) where the sex ratio is just greater than unity (1058 and 1001 respectively).
Figure 4: Sex Ratio (2001)
Delhi is in such a sorry state of affairs with a sex ratio of 821 females per thousand males. Who knows? The recent events in the capital city that have tarnished the pro women image of India in the international society could be an indication of this skewed sex ratio. Instead of merely blaming female foeticide, a host of social, health and environmental factors need to be brought under the microscope, if the skewed sex ratio has to be set right.
Literacy
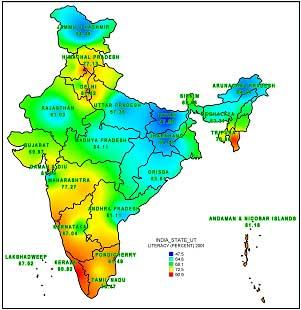
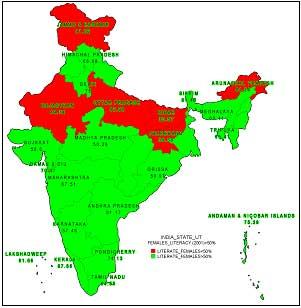
Literacy is an important indicator of social development. A person who can read and write with understanding in any language is treated as literate. A quick analysis of the states of India using GIS shows that Kerala tops with 90.92 percent (Figure 5). But an analysis of the female literacy rate shows that in some of the states female literacy is not even close to fifty percent. A classic example is Bihar whose history boasts of seat of knowledge like Nalanda University however has an overall literacy of only 47 percent with a female literacy rate of 33 percent.
Figure 5: Literacy Rate (2001)
A quick thematic analysis to see if atleast 50% of the females are literate shows that out of 35 only 28 pass the 50 percent mark (shown in light green-Figure 6) and in 7 states/ union territories (shown as red in Figure 6) less than 50 percent of the females are literate. It is necessary to increase the female literacy rate for several reasons including better population control, increased female life expectancy, better childcare etc.
Figure 6: Female Literacy Rate (2001)
Urbanization
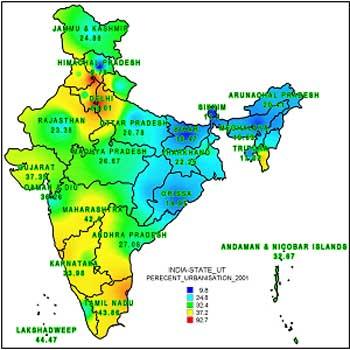
Urbanization is the increase in the proportion of people living in towns and cities. Urbanization occurs because people move from rural areas (countryside) to urban areas (towns and cities). Rural to urban migration is happening on a massive scale due to population pressure and lack of resources in rural areas. These are critical 'push' factors. The rapid pace of urbanization is inescapable and irreversible. It demands for increased utilization of the limited infrastructure in the cities. Failure to make note of this could lead to the break down of various infrastructure facilities, civic functions and depletion of natural resources like ground water in the cities. Delhi tops the list in terms of urbanization at 93.01percent. A grid thematic analysis clearly shows the urbanized areas by red spots (Figure 7).
Figure 7: Urbanization (2001)
Conclusion
Well we did hear what India had to tell us in the language of GIS on its state of affairs. The list of such GIS analysis in planning is really endless. GIS could not only be the possible key to unlock the latent problems in our cities and in our planning techniques but also the “key to unlocking a nations potential”. GIS could be the mirror that could reflect the state of the people contained in the cities of India. How they live? Where they live? What they do? More importantly the quality of life in the cities. GIS may not be the paragon of all virtues but it could be important as one of several measures for addressing the problems confronting the urban planners of today.
Of what use could be any technology if it cannot reach and benefit the common public suffering in the veritable concrete jungles, the so-called cities and the remote villages of India? It is a pity that it is not the people of the country who are starved but our planners and decision makers who are starved for want of information.
Multiplicity of institutions and duplication of data at various levels have marred the desired results. Most of the time is spent in making one department or the other as the scapegoat when the plans fail to give the desired results. Let us not get mired in history and "throw out the baby (GIS) with the bathwater". Constructive and creative suggestions are the need of the hour. Let us work towards finding ways and means of applying GIS for urban problems in a rational and a logical way.
Let the common man talk to our cities in the language of GIS. Let the common man understand what our cities, towns and villages have to say them. Let us empower them with Geospatial Democracy. Let them decide what the priorities are and let them make meaningful choices! A final thought: Let us empower the hoi polloi with the fundamental right to Geospatial Democracy before we hear the hoi polloi say: “Geospatial Democracy is my birth right and I shall have it !”
Thanks to Census of India for the data
Friday, April 29, 2005
GIS IS IN MY BLOOD
GIS IS IN MY BLOOD!
S.Raghavendran1
1 GIS Analyst
Email: srg_gis@yahoo.com
Give Me Blood! I Promise You Freedom!! This was the call by Netaji Subhash Chandra Bose at a rally of Indians in Burma, July 4, 1944 during India’s struggle for independence. Now we stand in an IT dominant era with tech savvy society, where most things happen at the click of a mouse. Phone calls to friends and relatives with a great deal of anxiety are quite common during medical emergencies arising out of accidents or illness or other such medical conditions. Any help from unknown quarters comes as a big relief. But one is often caught scrambling during such critical times for much-needed information, the information regarding blood donors. Those looking out for blood donors during such medical emergencies would understand the nightmare of not getting the required information at the appropriate time. Everyday thousands of lives are lost for want of blood at the appropriate time. When lives are at stake, every second counts and words cannot describe the plight of the near and dear ones, running from pillar to post in locating the blood donors. Geography or GIS for that matter has never been so closer offering a helping hand in our day-today life. Though GIS is being applied for logistics in transporting the accident victims to the appropriate hospital from the accident spot, evidences are not available regarding applying GIS for blood donors and receivers. In the recent past, help is available on the net: http://www.indianblooddonors.com a Nagpur-based website founded by Khusroo Poacha, that has information on blood donors across the country.
This paper is a proof-of-concept for the City of Chennai, to show how GIS can be used to quickly locate the blood donors of the required blood group nearer to a given hospital location on a GIS based map of Chennai City. The proof-of-concept is a GIS map based interface, a linkage of database of the blood donors and the base map of Chennai City, thereby creating a searchable interface for those in search of blood donors. It also showcases how clustering techniques can be used along with GIS to reduce the precious time lost in prioritizing which blood donors to contact. Right information, at the Right time, in the Right form – GIS could be the possible way!
The objective here is:
To create awareness on the need to integrate GIS into the daily lives of the hoi polloi at various levels.
To show how GIS can effectively be used in a myriad of ways to locate the blood donors quickly at the critical hour, thereby saving valuable human lives.
Of what use could be any technology if it cannot reach and benefit the common public suffering in the veritable concrete jungles, the so-called cities and the remote villages of India? It is a pity that technologies such as GIS and many such applications do not see the light of the day!
A final thought: With such a GIS application in place, I am sure to say “GIS is in my blood…Give me GIS and I promise you blood !”
Wednesday, August 04, 2004
FME
The subject matter of this paper in brevity is to demonstrate how FME can efficiently handle this burning issue of GIS interoperability, a major hurdle in building a geospatial data infrastructure and to drive home the point that in this “SAFE” route to GIS interoperability, “GIS file formats don’t matter!”
#30DayMapChallenge 2025: 04-Nov-2025 Day 4: My Data
04-Nov-2025 Day 4: My Data hashtag # 30DayMapChallenge 2025 Topi Tjukanov Theme: Data challenge: My Data This is where I was born, or ...
-
Topi Tjukanov of Finland launched the #30DayMapChallenge in 2019 where hundreds of maps were made and shared on social media using the #30D...
-
Topi Tjukanov of Finland launched the #30DayMapChallenge in 2019 where hundreds of maps were made and shared on social media using the #30D...
-
If you had chanced to look into maps made in medieval times, the dragons, multi-headed serpents and other strange fictional creatures markin...